
How BoardFluent works
Run the board and the go-to-market on the same numbers.
BoardFluent computes your SaaS metrics on published, versioned formulas, runs the board meeting around them, and grounds every GTM improvement in the same numbers the board already saw. When the next meeting asks what changed, the answer is already measured. Progress is measured, not narrated.
The problem
The quarterly reconciliation ends here.
The operating cadence lives in the CRM. The truth lives in the CFO's spreadsheet. The board sees a deck assembled the night before from both, and when the numbers do not tie, credibility takes the hit. BoardFluent gives the platform, the meeting, and the services one metric foundation to read from, so the next board meeting opens with evidence instead of a reconciliation.
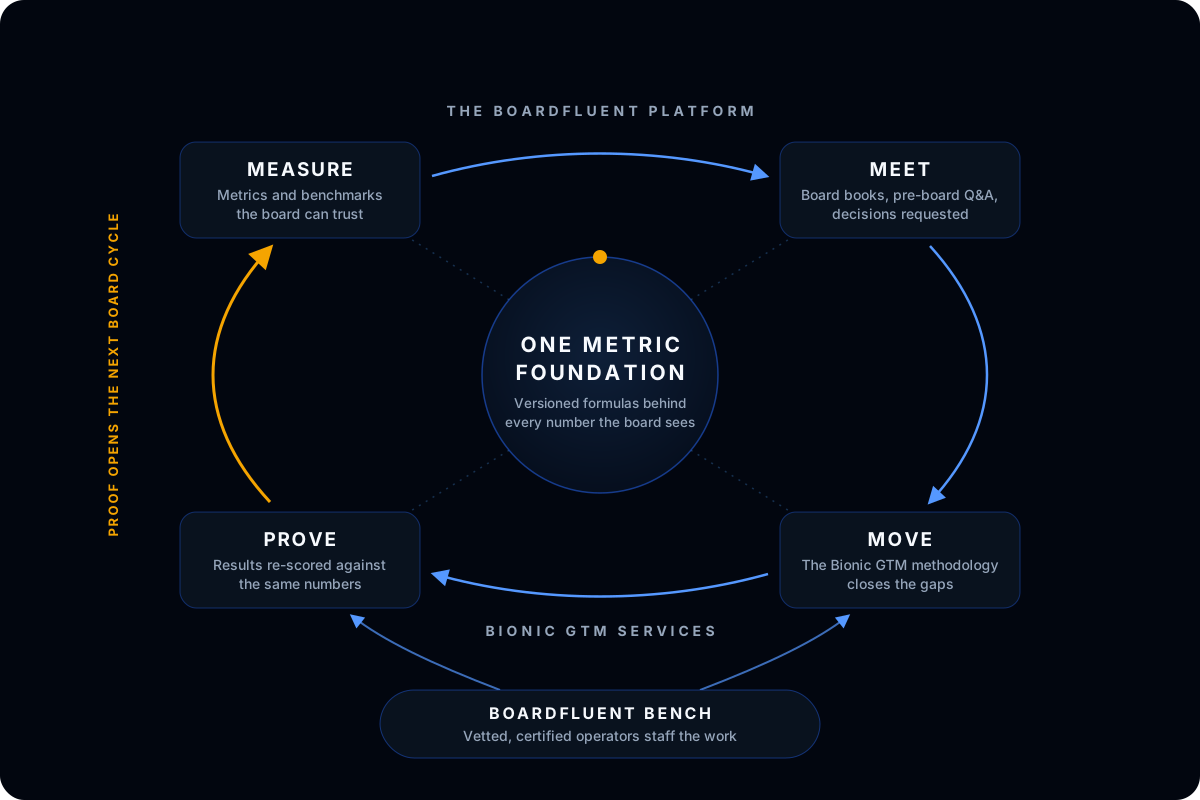
The loop
Measure, meet, move, prove. Then the loop closes.
Prove is the hinge. Without it, the platform and the services are two products. With it, the platform, the meeting, and the services form one loop that never presents the services as an add-on.
Prove
The same rubric re-scores the work, and the result opens the next board meeting as evidence instead of a reconciliation.
See how Prove worksFollow the metric
One number, four rooms, zero reconciliation.
Net revenue retention starts in the calculator and carries, unchanged, into the board book, the diagnostic, and the proof that the work moved it. Click through the loop below to watch the same number travel.
Net revenue retention, followed through the loop
Example dataNet Revenue Retention Calculator, v1
NRR = (Beginning revenue - churn - contraction + expansion) / Beginning revenue * 100
- Beginning revenue
- $7,000,000
- Churn
- $588,000
- Contraction
- $252,000
- Expansion
- $560,000
Computed by the same versioned formula behind the public NRR calculator, the board book tile below, and the diagnostic evidence line.
Board book tile, Tavolo Systems (illustrative)
Net Revenue Retention
Investor: Why is retention sitting at 96% this quarter?
Operator: Expansion is not yet offsetting churn and contraction in the installed base. Resolved once the retention work below is scoped.
The tile and the thread read the same NRR value the calculator computed, anchored so the board sees the question beside the number it is about.
Scored dimension
Retention and installed-base health
Whether the existing base is renewing, expanding, and compounding, or quietly leaking.
Evidence: Net revenue retention is 96%, below the expansion-offsets-churn line the rubric requires for a higher score.
Re-score, same dimension, same rubric
Retention and installed-base health
Baseline
Re-scored after Operate
Same rubric, same versioned formula, four quarters apart. The result opens the next board pack as evidence instead of a reconciliation.
Tavolo Systems, Dana Reyes, and Meridian Growth Partners are fictional, illustrative data used to demonstrate the product. No real company, investor, or person is represented.
One platform, three ways to engage it
The platform, the methodology, and the talent that delivers it.
The platform
Measures and runs the meeting.
Calculators, benchmarks, board books, pre-board Q&A, and decisions requested, all reading from the same versioned formulas.
Build a board packBionic GTM™
Closes the gaps the numbers reveal.
A published GTM methodology, instrumented in BoardFluent, delivered by senior operators with a frontier-AI analyst team.
The rubric, the formulas, the evidence standards, and the outcome tracking live in the platform. The operator brings judgment. The platform keeps it anchored to the numbers the board sees.
Request a GTM DiagnosticBoardFluent Bench
The vetted GTM operator network.
Need proven GTM talent, not a job board? The Bench places vetted operators, fractional CROs, and channel leaders into your company or portfolio. Matches are made by hand from verified track records and real relationship maps, and you see a named profile only when there is a fit. Placement is on contingency, paid by the hirer.
BoardFluent Bench is a private, vetted network of GTM operators, fractional CROs, and channel and partnership leaders. Members are matched to fractional, interim, advisory, and full-time mandates through verified track records, and can certify to deliver Bionic GTM engagements on the BoardFluent platform. Profiles stay hidden by default. Relationships are qualifications, never inventory. Hirers pay the placement fee, never the operator.

About the founder
Built by an operator who sat in the seat.
Mike Dayton spent 20+ years leading revenue organizations as CRO, CSO, and GM at PE-backed, public, and founder-led companies. The night before a board meeting always looked the same: spreadsheets open, hunting down inputs, double-checking the math, aligning the story so the room walked in with one set of numbers. BoardFluent is the reference he wished he'd had, so that alignment happens days early instead of the night before.